Statistical classification involves the use of various methods and metrics to discriminate outcome variables into their correct groups using input variables. The algorithms used to do this are called classification systems, or classifiers. There are various metrics we use to gauge the performance of our classification systems. If we are referring exclusively to binary outputs, then we can use sensitivity, specificity, Positive and Negative Predictive Value, and correct classification percentage.
Accuracy is defined as the total number of correctly classified observations, divided by the total number of observations.

There exists some problems with this metric. If the condition we are trying to predict occurs at a rate nearing 1, then we can simply predict that all observations will be positive. This will give us a very strong accuracy, but obviously is not very good for prediction.
Positive Predictive Value is defined as the total number of correctly predicted positive outcomes from the test, divided by the total number of predicted positive outcomes (correctly predicted or not).

Negative Predictive Value is defined as the total number of correctly predicted negative outcomes, divided by the total number of predicted negative outcomes.

Sensitivity, also called the True Positive Rate or Recall Rate, is defined as the total number of correctly predicted positive outcomes, divided by the total number of positive outcomes.

Specificity, also called the True Negative Rate, is defined as the total number of correctly predicted negative outcomes, divided by the total number of negative outcomes.

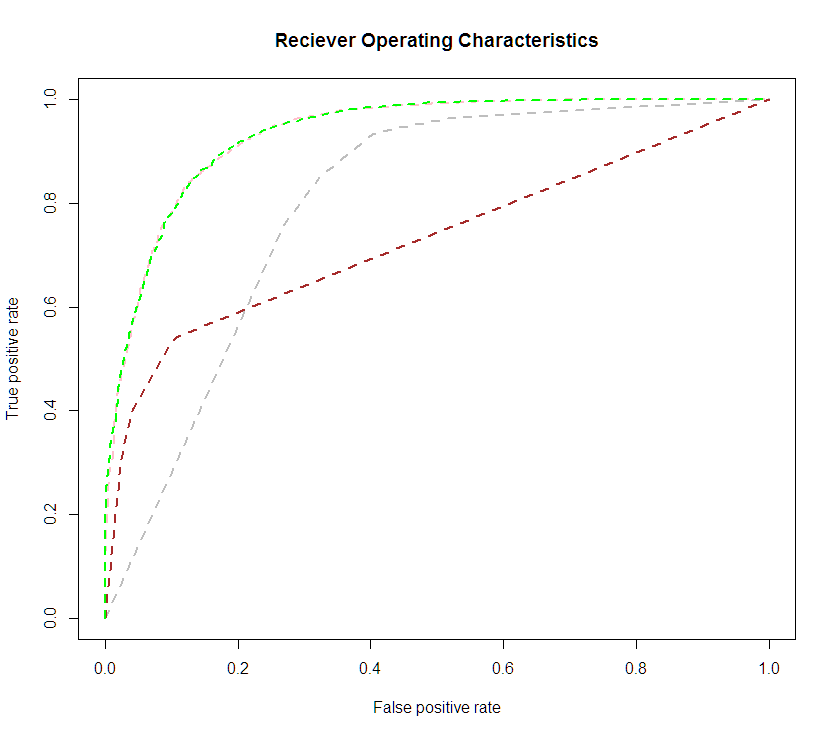
Reciever Operating Characteristics are a graphical representation of the performance of the classifier. The ROC curve is a two-dimensional plot with Sensitivity on the Y axis,  Specificity on the X axis. The purpose is to observe how the sensitivity and specificity change as you vary the discrimination criteria. Most classification models will put out a value between 0 or 1 that represents the “odds” that that observation is a 1. the discrimination criteria is the cutoff point on that range (0,1) for which you declare that observation to be a 1. As you vary that cutoff point, you generate lines on the ROC curve. Then you pick the best cutoff point. In absence of other criteria for determining the best cutoff point, we will typically use the value that maximizes the lift, or distance between the observed sensitivity, specificity, and the diagonal line, where sensitivity is equal to specificity. This distance gives us a measure of how much better we’re doing than random guess.
The linked image is an example ROC curve from a paper where I was comparing classifier methods. Each color represents a method used. The closer the ROC curve gets to the upper left corner, the more powerful it is.
There is another metric associated with the ROC curve, called the area under the curve. If we calculate the Area under the curve, or AUC, we get a number somewhere between 0 and 1. At first glance, this might seem a useful method of comparing two classifier methods, since holding the shape of the curves constant, a higher AUC indicates a more powerful classifier. However, the AUC ignores where along the ROC curve we might want that power. If we can tolerate a false positive rate of only so high, then we have to make comparisons in lift at those thresholds, rather than calculating a single metric like AUC.
Additional Resources:
Wikipedia – Confusion Matrix – Worked Example
SaedSayed – Model Evaluation